9  Data

9.1 Map of Brazilian regions

R package geobr

library(geobr)
library(ggplot2)

map <- read_state(year = 2020, showProgress = FALSE)
# length(unique(map$code_state)) # number of states: 27
ggplot(map) + geom_sf() + labs(title = "States")

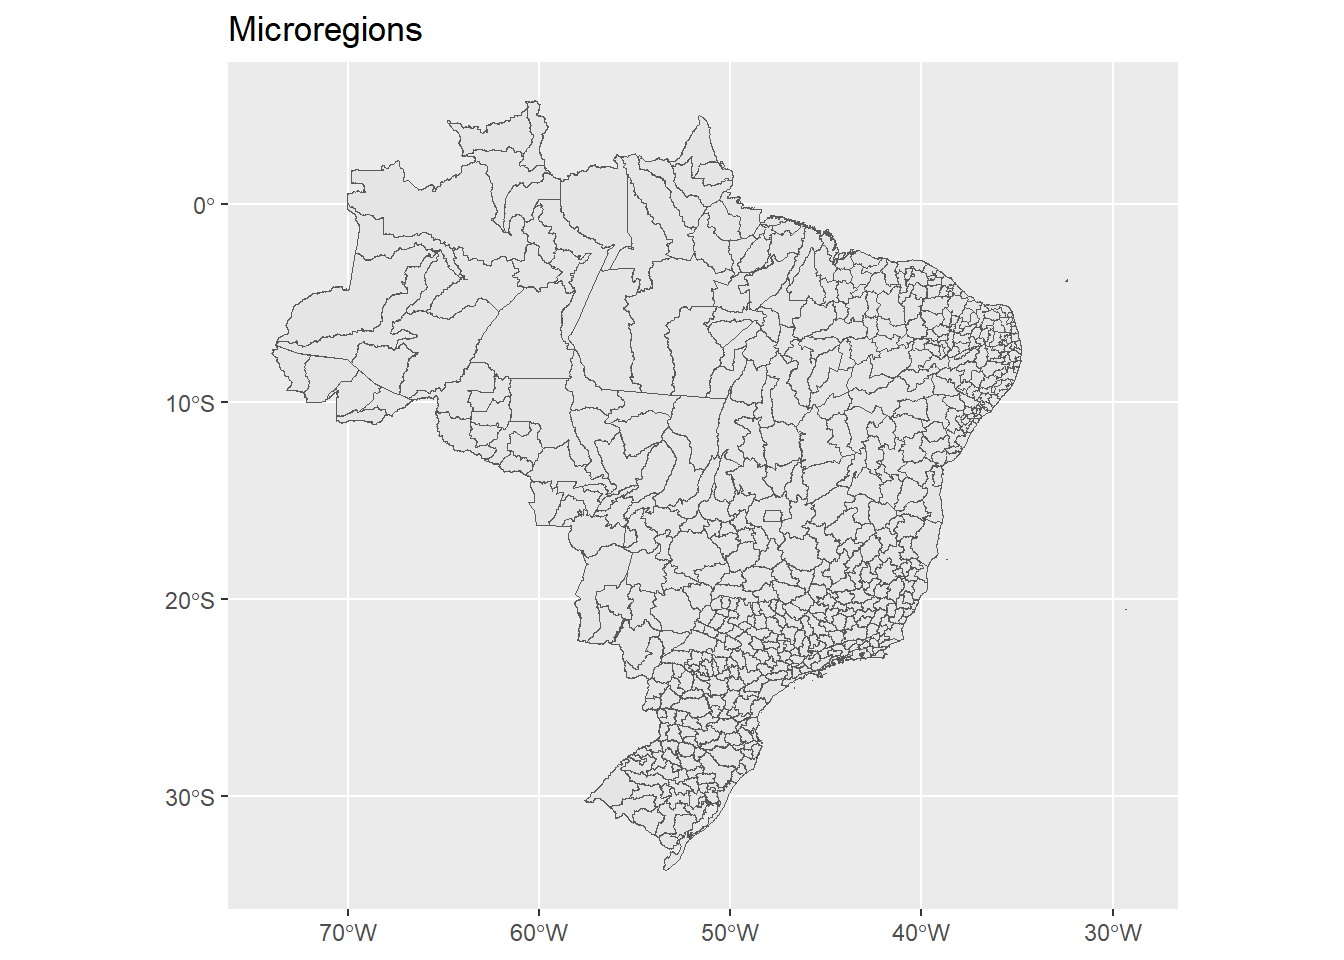
map <- read_micro_region(year = 2020, showProgress = FALSE)
# length(unique(map$code_micro)) # number of microregions: 558
ggplot(map) + geom_sf() + labs(title = "Microregions")

map <- read_municipality(year = 2020, showProgress = FALSE)
# length(unique(map$code_muni)) # number of municipalities: 5570
ggplot(map) + geom_sf() + labs(title = "Municipalities")

9.2 Dengue data

InfoDengue

InfoDengue API

Dengue cases, nowcasts, temperature and humidity by city level and epidemiological week

url <- "https://info.dengue.mat.br/api/alertcity?"
geocode <- 3304557
disease <- "dengue"
format <- "csv"
ew_start <- 1
ew_end <- 52
ey_start <- 2021
ey_end <- 2021

cons1 <- paste0(url,"geocode=",geocode,"&disease=",disease,"&format=",format,"&ew_start=",ew_start,"&ew_end=",ew_end,"&ey_start=",ey_start,"&ey_end=",ey_end)


library(tidyverse)
d <- read_csv(cons1, show_col_types=FALSE) %>% arrange(data_iniSE)
glimpse(d)
ggplot(d, aes(SE, casos)) + geom_line()

Dengue incidence rate (cases per 100 000 residents per month) for ten Brazilian states (São Paulo and Minas Gerais from the southeast, Rio Grande do Sul and Santa Catarina from the south, Mato Grosso do Sul and Goias from the midwest, Ceará and Bahia from the northeast, Pará and Amazonas from the north). It is clear that the incidence rate is influenced by geographical and environmental factors, as described in Lowe et al. (2021)

9.4 Population

9.5 Climate

  • Temperature
  • Precipitation
  • Humidity
  • El Niño/Southern Oscillation (ENSO) index
  • Historical and future data

9.6 Environment

9.7 Socio-economic